
By Dan Buckler, DNR urban forest assessment specialist, Madison, daniel.buckler@wisconsin.gov, 608-445-4578
 Jack Frost descends upon us all in Wisconsin, but the depths to which he brings the mercury differ depending on your latitude, elevation, and proximity to water or urban areas. These differences are observed in a location’s cold hardiness zone, which represents the average minimum temperature a location is expected to experience.
Cold hardiness zones are well-known decision-making factors for anybody with a smidge of green on their thumb. But did you know that there are multiple hardiness zone maps out there, and that where you stand right now might be in zone 6 on one map, but zone 5 on another? Enter the labyrinth, dear reader.
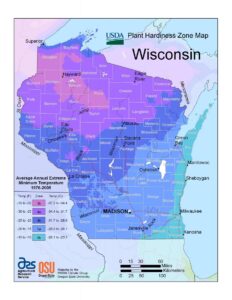
The most widespread and authoritative cold hardiness zone map was released by the USDA. First produced in 1960, this map has undergone a few irregular iterations over the last sixty years, most recently updated in 2012 with temperature data used through 2005. In addition to incorporating local variations into its model (e.g. elevation data), the USDA map also differentiates each zone into two subdivisions. Wisconsin zones, for example, range from 3b (Hayward) to 6a (a miniscule sliver along the Port of Milwaukee).
Though not challenging the supremacy of the USDA map, the Arbor Day Foundation has produced its own cold hardiness zone map, most recently in 2015. The incorporation of newer data (through 2015) was partially pursued to help capture zone shifts due to climate change. As such, you’ll see higher numbered hardiness zones with the Arbor Day map. Whereas the USDA marks Racine as 5b, it is a 6 in the ADF map. The appropriately named Winter is in 3b with the USDA, but 4 with the ADF. Some places also have multiple zones listed, in recognition of the microclimates making a one-size-fits-all zone classification impossible. This author’s home on Milwaukee’s west side, for example, is 5-6.
Other cold hardiness zone maps have come and gone, but these are the two most prominent still standing. The Wisconsin DNR usually cites the USDA-derived zones due to the fineness of the data (for example, compare the Driftless Area in both maps), but both maps are good. If the USDA map were updated today, we might see that a significant chunk of the Lake Michigan coast would be zone 6, just as the ADF map shows.
Indeed, zones are expected to change in the coming decades, as our climate gets warmer. This is as good of a time as any to experiment with some trees that might not have been appropriate when you were growing up. Cities are already outsized petri dishes for new trees due to their warmer temperatures.
But before you plant your southern forest, recognize that seed provenance is important too, not just the species’ expected hardiness zone. After all, tulip-poplar is native from southern Michigan (a chilly 5b) to northern Florida (a balmy 9a). If you were to introduce some of these trees into Wisconsin, it would be wise not to use seeds originating in far south locations. Unless you have extra mittens, coats and beanies.