
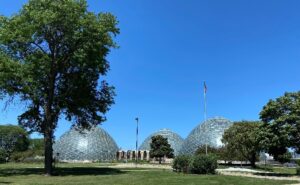
Mitchell Park Domes. Credit: WDNR
Wisconsin DNR urban forest assessment specialist Dan Buckler had been monitoring weather forecasts for a month, waiting for just the right blisteringly hot day to launch a much-anticipated Milwaukee heat island mapping project. He’d been laser-focused on getting the one-day blitz in the books, and July 21 turned out to be go time.
The urban heat island effect explains the phenomenon that densely developed urban spaces are warmer than outlying places due to man-made surfaces (such as asphalt) absorbing and reradiating heat through the day and night. Trees are one method of reducing urban temperatures by providing shade and by putting more water vapor into the air via evapotranspiration.
Starting from the Mitchell Park Domes, Buckler dispatched dozens of volunteer citizen scientists in teams of two: one driver, one navigator. Each was given a special sensor which was enclosed in a nondescript PVC pipe. It protruded from a car window and was attached inside to a small computer capable of recording heat and humidity data every single second. Teams drove for one hour in the morning, afternoon and evening, maneuvering around nine circuitous routes.
It was a first-of-its-kind campaign in Milwaukee, and an important one, as city-wide heat data had never been captured before. With it, foresters, city leaders, and others would have a much better handle on how best to focus heat mitigation resources.
Buckler says that, once analyzed, the data could help save lives and improve people’s health, while making at-risk neighborhoods not just cooler, but more beautiful when new tree canopies rise.
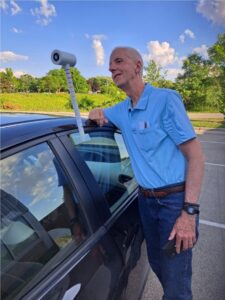
Volunteer with heat mapping device attached to car. Credit: WDNR
The urban forester started putting out feelers about the project a couple of years ago. Interest from city agencies, environmental and other groups began to swell as more and more devastating heat waves gripped the globe.
“Until the last couple of years, [urban heat] has not been on people’s radar. They weren’t recognizing that heat is the deadliest weather event in the United States. It’s not hurricanes or tornadoes. It’s heat, and it’s not just the mortality, but you need to examine it from a morbidity standpoint. Heat causes illness. It causes you to feel bad and can have an incredibly negative impact on your health,” explained Buckler.
To pull off the urban heat island mapping project in a single day, Buckler knew he’d need lots of volunteers, and began recruiting months ago. The Milwaukee Health Department, the Milwaukee Metropolitan Sewerage District, Groundwork Milwaukee – an environmental equity and land stewardship organization – were among a dozen or so that jumped on board.
Buckler had already secured federal funds for the campaign through the National Oceanic and Atmospheric Administration (NOAA) which has been sponsoring heat mapping campaigns in several U.S. cities. NOAA does so by contracting with a private group, Climate Adaption Planning and Analytics, or CAPA Strategies. The organization supplies equipment, provides analysis and produces urban heat island maps that can help guide important decision making: where to plant new trees, place cooling centers and bus stops, even identify areas where painting dark pavement lighter colors might lessen the impact of heat.
“There are going to be a lot of discussions on this once we get the data and we reconvene the participants – these partnering organizations – so that’s super exciting,” remarked Buckler.
He said two shifts (6-7 a.m. and 7-8 p.m.) on “go day” were very good (good = hot and sunny). “But a pop-up storm developed during the 3-4 p.m. shift affecting a few of the routes. We got useable data, but it could have been better, and I ultimately decided to try the afternoon shift again the next day, as the weather was forecasted to be hot and sunny that day too. So, Thursday night and Friday morning I scrambled to find people to pursue the data collection, and I was successful! So, we redid the afternoon shift, and it went perfectly.”
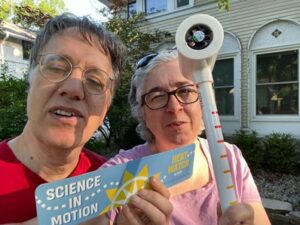
David Tripp and Jenny Abel hold a sensor that was attached to their car window, which collected temperature and humidity data in the City of Milwaukee. Credit: WDNR
As an urban forester, he’ll be particularly interested in how data might lead to more tree planting.
“We know trees can provide cooling, but they provide all sorts of other benefits as well, so it’s really awesome that that engineering solution doesn’t just stop at heat. Trees help reduce stormwater and air pollution, and give us so many mental and physical health benefits. I just love helping tell the stories of trees, the many great things they can provide our communities, and I think this project is all part of that broader strategy.”
Temperature maps of the city are expected back in a couple of months.