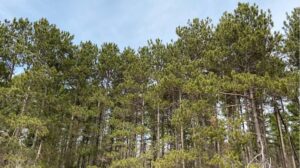
A stand of red pine trees towers over its Wisconsin stand. / Photo Credit: Wisconsin DNR
By Ryan Heiderman, DNR Forest Inventory Analyst
Ryan.Heiderman@wisconsin.gov
Of Wisconsin’s almost 17 million acres of forest land, the red pine forest type currently covers approximately 815,000 acres. Of those red pine acres, 80%, or 656,000 acres, are planted.
Overall, the acres of red pine have increased substantially since the cutover period of the early 1900s (Figure 1), particularly from planted red pine. In the 1939 report summarizing Wisconsin’s first periodic forest inventory, the authors give a dire warning stating that, with the exception of jack pine, the pine forests are almost gone, having been depleted and deforested in the decades prior.
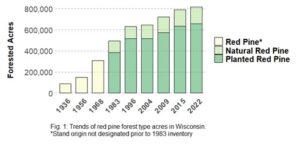
Chart showing trends of red pine forest type acres in Wisconsin. The asterisk indicates that stand origin was not designated prior to the 1983 inventory. / Graphic Credit: Ryan Heiderman, Wisconsin DNR
This early inventory indicated much of the deforested sandy pine forest had become occupied by aspen, paper birch and scrub oak. They went on to say while natural regeneration might be expected eventually, indications were that it would be slow, and planting seemed to be the only recourse if early reforestation was to be accomplished.
Reporting on the next periodic inventory in 1956, the authors highlighted that red pine acres were ‘coming back’ and white pine acres fading. They reported that much of the tree planting that had been done since the previous inventory was mostly red pine. Echoing the advice from the earlier inventory report, the authors again stated the importance of forest planting – saying reforestation could increase the acreage of productive forest land, but the planting job was a big one. At the time, they reported some 148,000 acres of the red pine forest type. They reported that over half (53%) of these red pine acres were on public lands. Today, more than 60% of red pine acres are in privately-owned forests.
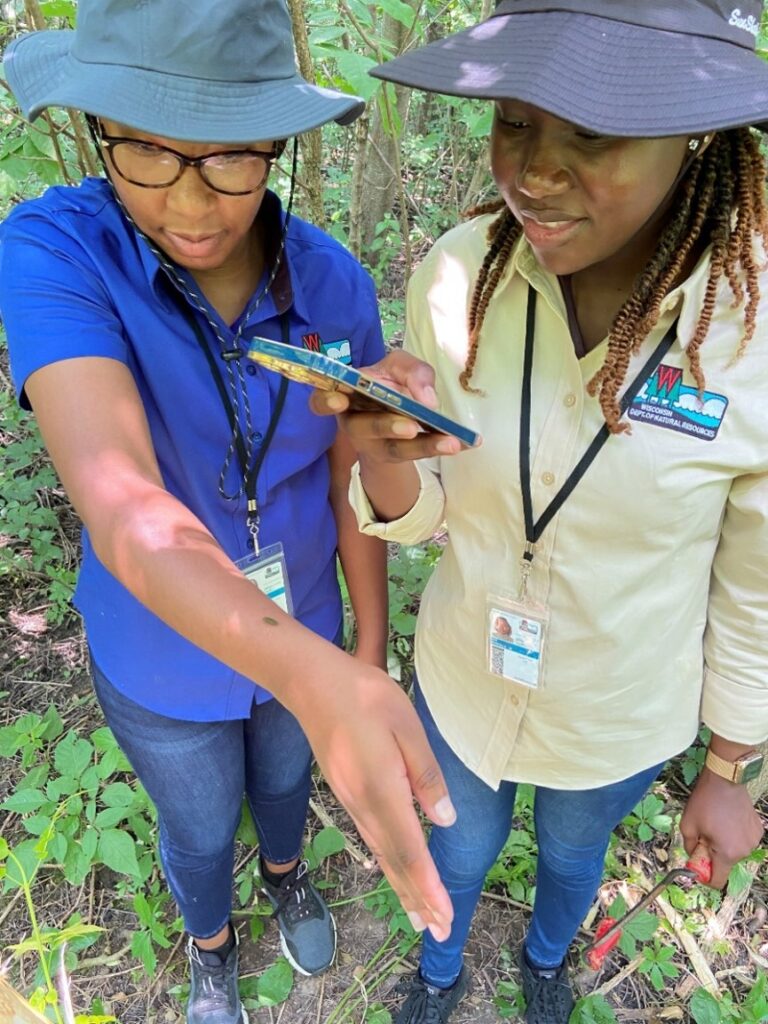 The application period is now open for hundreds of internships with the state of Wisconsin, including two positions with the DNR’s Urban Forestry program!
 Tree City USA is an annual recognition program presented by the Arbor Day Foundation that allows communities to publicly demonstrate their continued commitment to the care of their local urban forest. Returning Tree City USA communities are also eligible to apply for Growth Awards. These awards recognize community forestry programs that go above and beyond the four core tenets of Tree City USA.